If your school district were graded on your career and college efforts, would it pass? When asked, only 39% of students, educators, and district leaders said yes—giving their schools a C or above on the 2022 K-12 CCR Benchmark.
Career and college readiness is a complex and constantly-changing landscape. From evolving workforce needs to a renewed focus on equity in career outcomes, building a cohesive picture of success is like chasing a moving target.
The CCR Benchmark, an initiative created by a coalition of K-12 education leaders, was created to help districts do just that: leverage a common definition of success to self-assess their CCR initiatives against the most prevalent requirements and recommended best practices in the country.
About the K-12 Career and College
Readiness Self-Assessment
The K-12 CCR Benchmark was designed in coordination with WGU Labs, an affiliate of Western Governors University, by surveying state CCR regulations and published best practices from relevant professional organizations. View the full set of CCR indicators here.
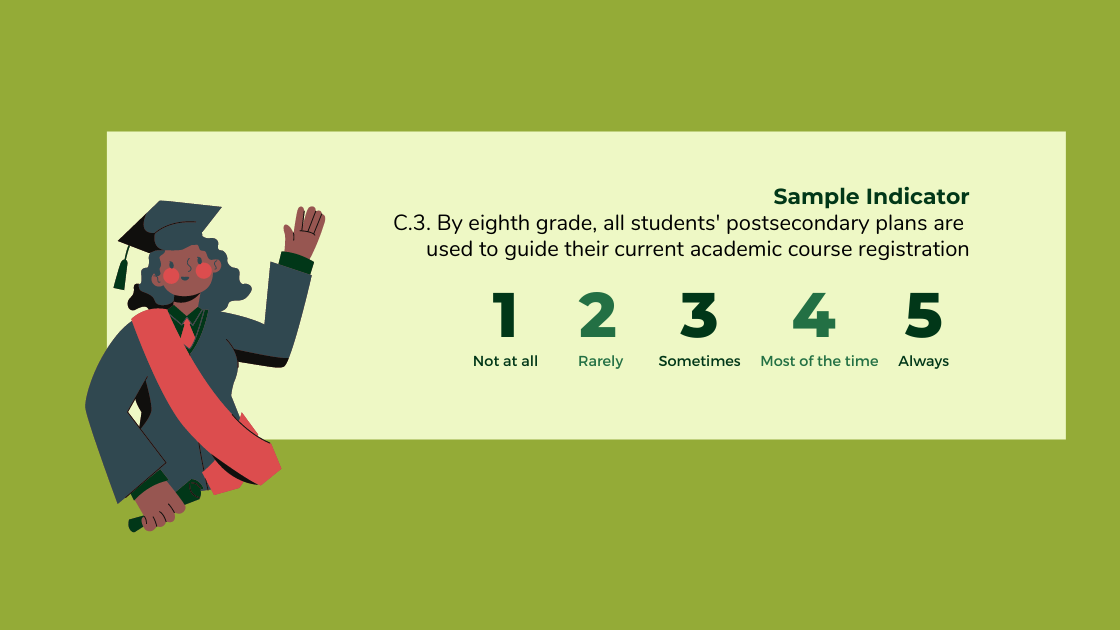
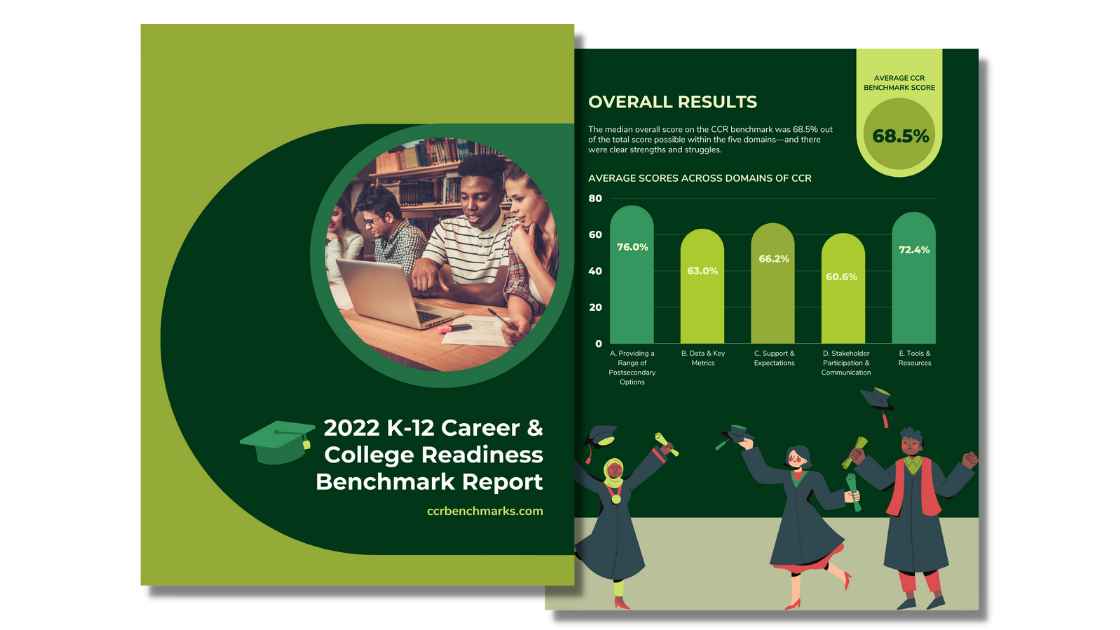
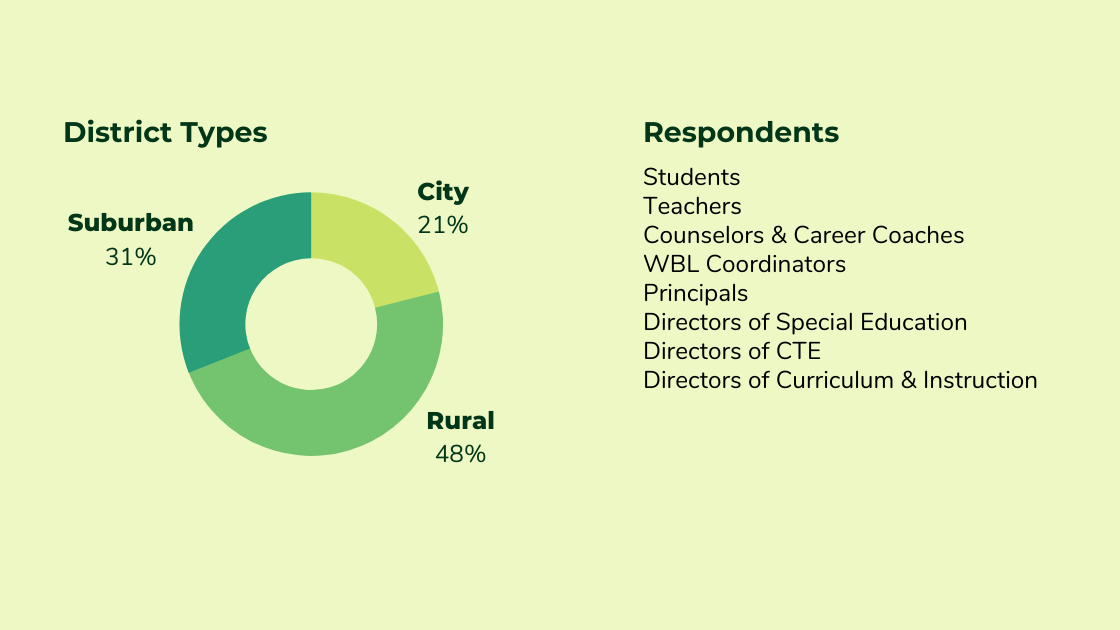
The 2022 Benchmark Report was created by surveying more than 140 students, teachers, and district leaders about their career and college readiness practices. Respondents were asked to respond to a series of questions on a five-point scale about five key domains:
-
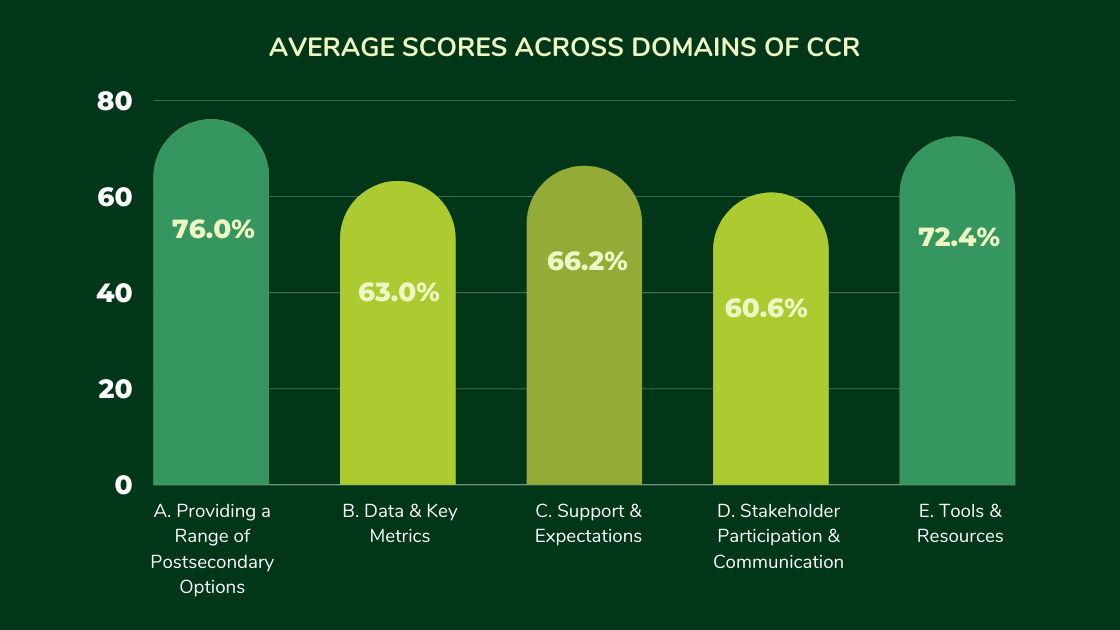
Providing a Range of Postsecondary Options
-
Data & Key Metrics
-
Support & Expectations
-
Stakeholder Communication
-
Tools & Resources
3 Clear CCR Trends from the Data
1: Engaging stakeholders meaningfully is our greatest struggle
One of the most persistent challenges of career and college readiness efforts is that despite being a primary objective of K-12 education, CCR work is often siloed or lacks a clear owner.
The data shows this struggle persists in 2022—the indicators relevant to engaging key stakeholders like parents, teachers, and community workforce leaders were the lowest point-receiving on the entire benchmark. As a category, “Stakeholder Communication” scored the lowest overall, with an average score of only 60.6%.
2: Leadership—especially principals—believe they’re doing better at CCR than students and teachers do.
Perspective is everything. Across all five domains covered within the Benchmark, principals and district leaders rated CCR efforts more highly than teachers and students did, by a difference as great as 13 percentage points.
Put another way: while principals awarded an average of 81% points possible for providing a range of postsecondary options, students—the main recipients of these efforts—averaged 61%. This speaks to a stark difference in experience between the organizers and participants in CCR efforts.
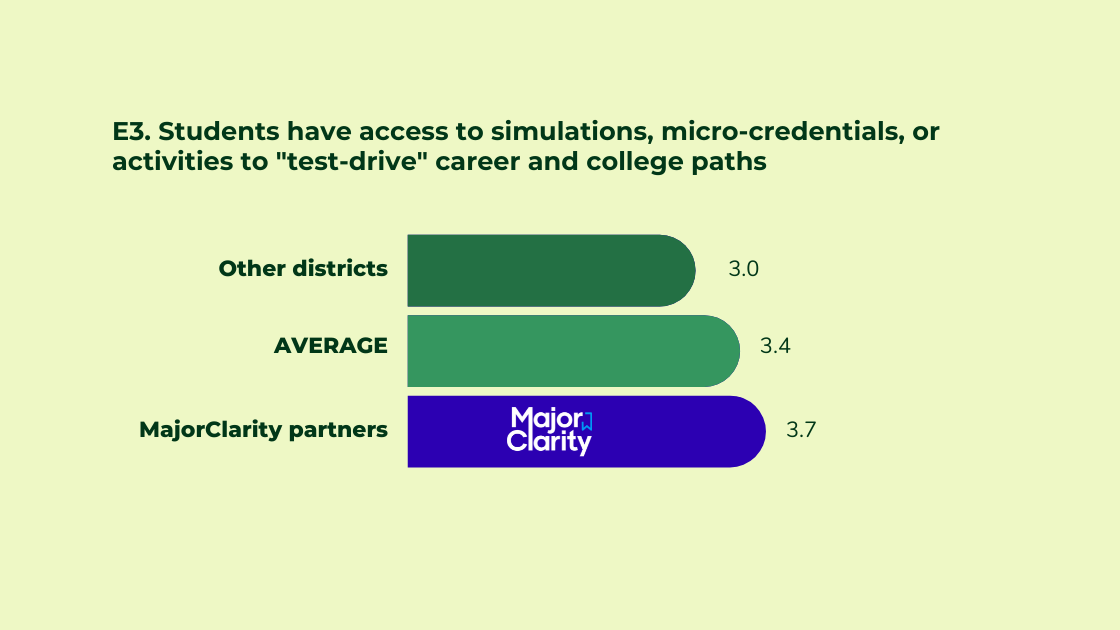
3: Interactive career exploration content is critical… and something that many students lack access to.
Research tells us that students don’t retain text-based career content; in response, CCR has moved toward more experiential learning to build meaningful connections that can ultimately drive academic and postsecondary planning. But when compared to general access to postsecondary information and other tools/resources, access to experiences for career exploration lags behind. Activities like work-based learning, career test-drives, and other simulations can be life-changing for students weighing expensive postsecondary options… and yet many don’t have access to these opportunities.
Get Access to the Full 2022 Results Data
Click the button below to access the 2022 Benchmark report and read the breakdown of 9 Key Takeaways from this year’s CCR data.

Watch the live breakdown and tips for "Benchmarking your CCR Efforts," including 9 key data points from the report.